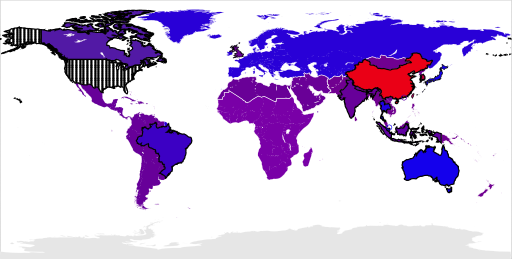
A simple data mash-up I’m surprised I’ve never seen before: number of high-net-worth individuals (HNWIs) vs. number of people who bought a U.S. green card through the EB-5 investor visa programme in the past five years, by country or region. The former number comes from Capgemini’s 2013 World Wealth Report (WWR), specifically the section on HNWI population estimates; the latter number comes from the State Department’s Report of the Visa Office, specifically Table VI, Part IV for each year.
| How many HNWIs in each country or region obtained EB-5 green cards in 2009–2013? | |||
|---|---|---|---|
 |
1 in 29 | ||
| 1 in 64 | |||
| 1 in 128 | |||
| 1 in 256 | |||
| 1 in 512 | |||
| 1 in 1,024 | |||
| 1 in 2,048 | |||
| 1 in 4,096 | |||
| 1 in 8,192 | |||
| 1 in 11,643 | |||
Note that except for certain countries, the WWR only provided estimates of HNWIs on a regional basis. The above map was thus coloured in by taking the total of EB-5s for the region and dividing it by the number of HNWIs; this means that some countries in the map are coloured in according to the average for the broader region, even though no one at all from that country got an EB-5 in the five-year period in question. Where the WWR did provide a country-specific estimate of the number of HNWIs, the country is outlined in black, except for Hong Kong and Singapore which are circled.


